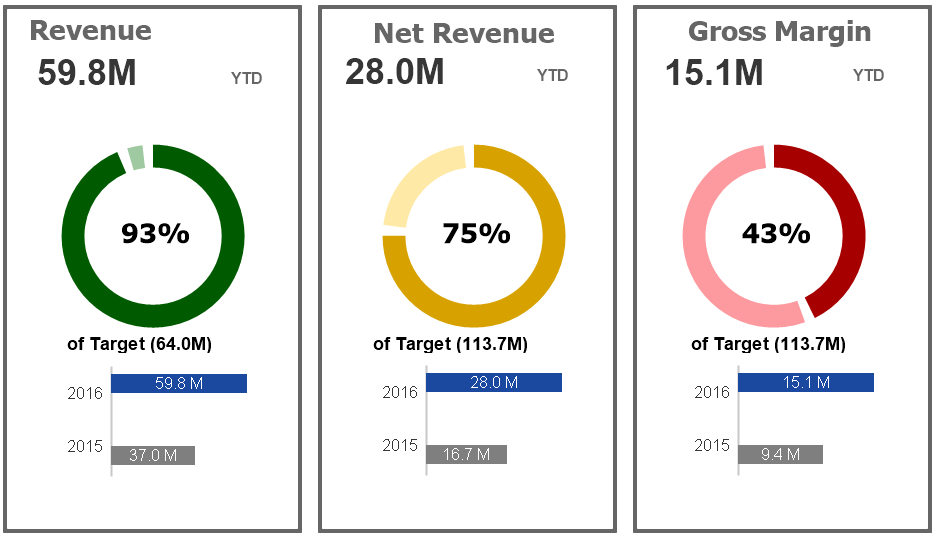
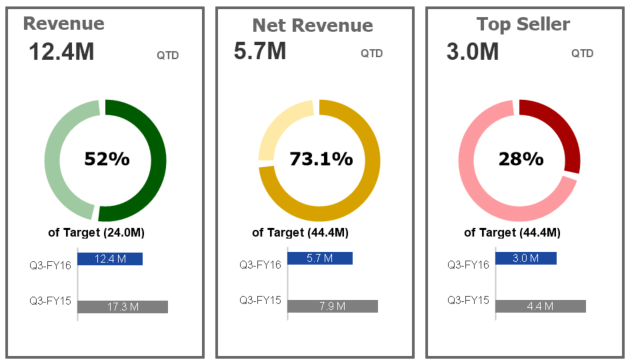
A well laid out QlikView designed visualization capturing multiple KPI's.
Objects used:
Gauges charts combined with color variation logic, segment overlay for gaps, bar chart.
Customizable, extensible, configurable.
(Sample data set presented).
- Top left highlighting metric being captured.
- Top right indicating period selected (from YTD, QTD, MTD).
- % of Target indicator in center of Gauge Chart, indicating progress towards goal.
- Color coding of gauge chart to indicate secondary metric tracking.
- Color dynamically changing based on period selected.
- Bar chart comparing metric data YoY.
No comments:
Post a Comment